Prestige in Social Network Analysis
(This is a companion to my MPACT poster post.)
In my ASIST short paper and poster on the MPACT dataset I investigated three prestige measures: 1) outdegree, 2) output domain, and 3) proximity prestige. While all three measures were correlated, I found low correlation for prestige ranking and citation count ranking. Sugimoto et al.’s (2008) analysis also found little to no correlation between raw counts of dissertation committee participation and citation counts.
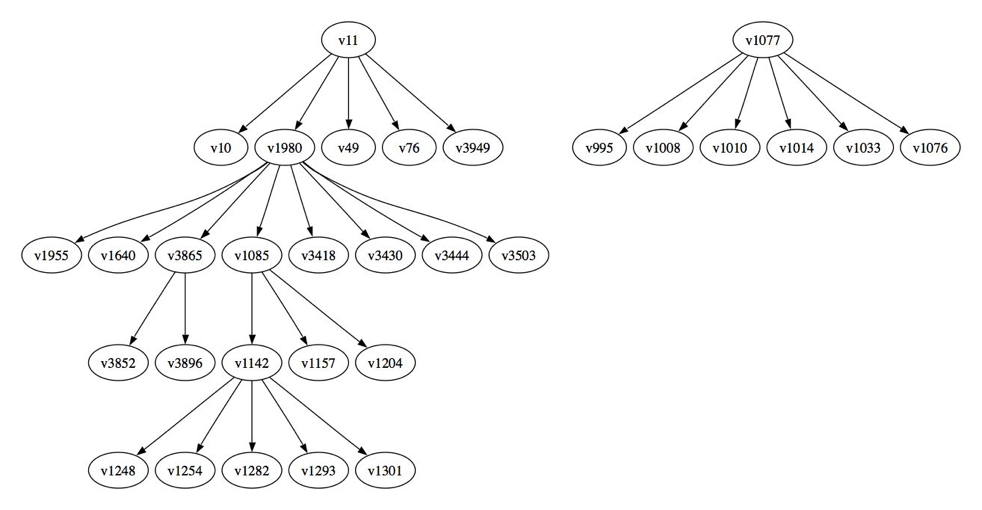
So what is prestige as measured here? Consider this network, taken from the dataset I used for the poster. The network has two advisors, v11 and v1077, and their respective advisees. v11 advised five dissertations, and one of these dissertation authors, v1980, later advised eight dissertations, from which emerged further generations of dissertations. v1077 advised six dissertations. The network has a total of 31 nodes and 29 directed edges (arcs).
Quoting from my ASIST short paper:
The outdegree of a node is the number of arcs originating from that node. In this example outdegree corresponds to the number of advisees supervised by a faculty member. Node v11 has outdegree of 5, while node v1077 has outdegree of 6. A node with no outgoing arcs, such as v3852, has outdegree of 0. Outdegree corresponds to the measure A (number of advisees) used by Marchionini et al. (2006).
The output domain of a node is the number of nodes for which there is a path to that node. For example, v3865 has output domain 2, as two nodes, v3852 and v3896, can be reached from it, while v3503 has output domain 0. v11 has output domain 23, which is the total number of its descendants. The v1077 has output domain 6, the same as its outdegree, as there are no additional nodes to be reached from its neighbors. So this measure takes into account v11’s impact across multiple generations of dissertation authors, but all contributions are counted equally. That is, v1282 contributes the same as v49 to v11’s mentoring impact,
Proximity prestige refines output domain by having closer neighbors count more than far-away neighbors. Following de Nooy et al.’s definition, the proximity prestige of a node is the proportion of all nodes in the network (excluding itself) that are in its output domain divided by the mean distance from all nodes in its output domain. By definition all nodes with zero output domain get zero proximity prestige. The output domain of v3685 contains two nodes (v3852 and v3896), which is 2 out of 30 (0.0667). Average distance within the output domain of v3865 is 1, so proximity prestige for v3865 is 0.0667 divided by 1. For v11, it has input domain of 23 divided by 30 (0.767) and average distance of 3.304, for proximity prestige of 0.232. v1077 has proximity prestige 0.2. Advisor v11, having more descendants than advisor 1077, has higher proximity prestige.
So output domain and proximity prestige both get closer to what I had in mind than outdegree, that having multiple generations of academic descendants should count in some way in addition to the number of one’s immediate descendants.